11
11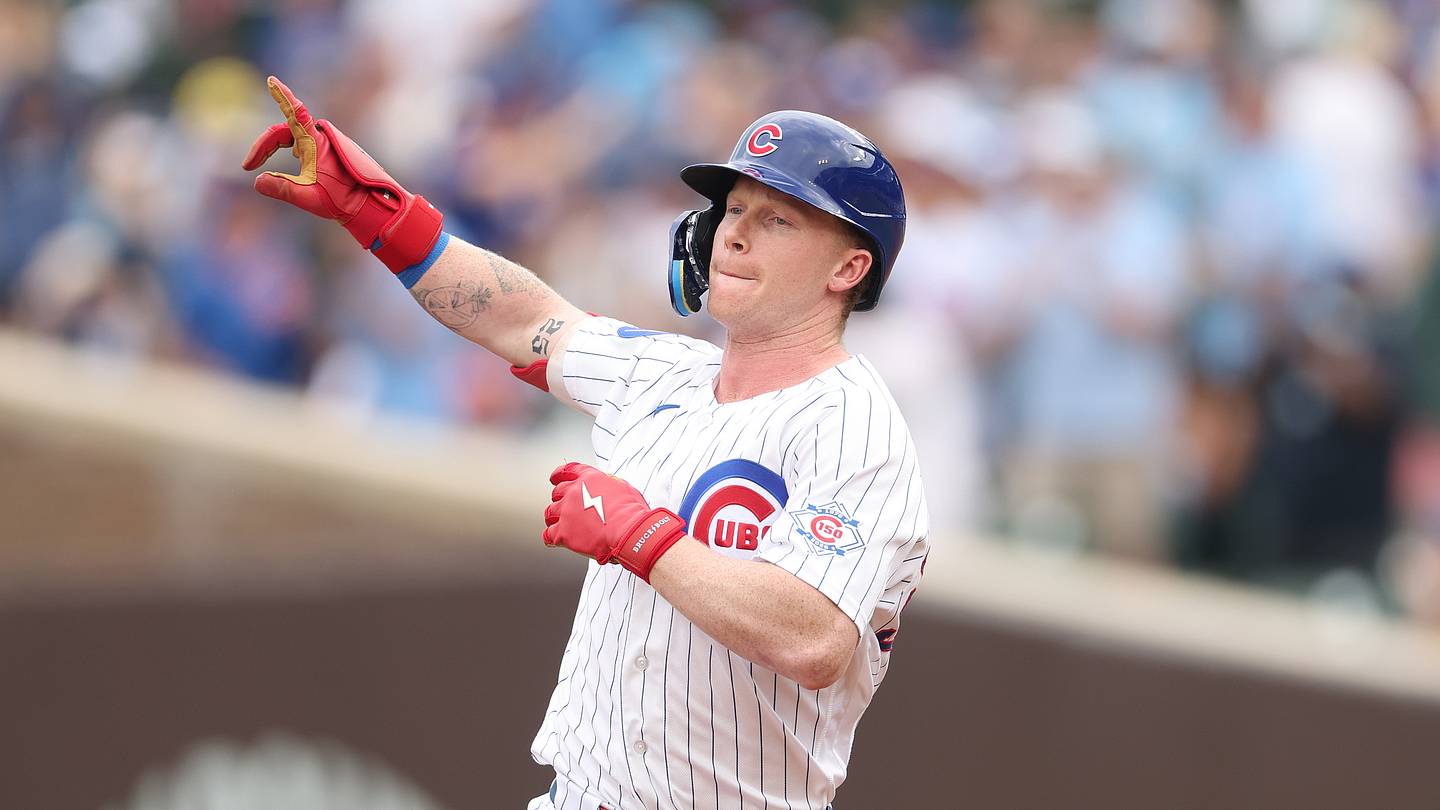
Imagine if you had a super-powered calculator that could look at every baseball game played so far, every player’s stats, every injury, and every trade—and then tell you exactly how the rest of the season will play out. That’s basically what Opta Analyst does!
Important Point: The MLB trade deadline has passed, which means teams can no longer swap players. Rosters are mostly set for the rest of the season. Now we wait to see who makes the playoffs!
Opta Analyst (powered by the Stats platform) runs thousands of simulations to predict the future. It’s not magic—it’s math! The computer gives each team a percentage chance of making the playoffs. Think of it like a weather forecast: "90% chance of rain" means it’s very likely, but not guaranteed.
Before we dive in, here’s a quick refresher:
The supercomputer has spoken! Here are the projected final standings for the AL Wild Card race:
| Seed | Team | Predicted Wins | Predicted Losses | Playoff % |
|---|---|---|---|---|
| WC1 | New York Yankees | 90.5 | 71.5 | 97.5% |
| WC2 | Boston Red Sox | 90.0 | 72.0 | 96.3% |
| WC3 | Detroit Tigers | 81.6 | 80.4 | 41.0% |
| OUT | Cleveland Guardians | 80.9 | 81.1 | 35.9% |
| OUT | Texas Rangers | 80.2 | 81.8 | 35.2% |
| OUT | Seattle Mariners | 79.3 | 82.8 | 28.9% |
| OUT | Baltimore Orioles | 78.9 | 83.1 | 17.8% |
| OUT | Minnesota Twins | 77.4 | 84.6 | 11.4% |
Key Takeaway: The Yankees and Red Sox are basically locked in for the playoffs. The computer gives them both over a 96% chance—that’s "bet your allowance money" territory!
The Big Surprise: Detroit Tigers
The Odd Team Out: Cleveland Guardians
Now let’s look at the Senior Circuit:
| Seed | Team | Predicted Wins | Predicted Losses | Playoff % |
|---|---|---|---|---|
| WC1 | Chicago Cubs | 92.0 | 70.0 | 96.6% |
| WC2 | Arizona Diamondbacks | 85.7 | 76.3 | 63.2% |
| WC3 | Philadelphia Phillies | 85.1 | 76.9 | 56.6% |
| OUT | San Diego Padres | 82.4 | 79.6 | 27.4% |
| OUT | Miami Marlins | 80.7 | 81.3 | 19.3% |
| OUT | St. Louis Cardinals | 80.1 | 81.9 | 13.2% |
| OUT | Pittsburgh Pirates | 80.1 | 81.9 | 11.8% |
| OUT | Washington Nationals | 79.3 | 82.7 | 9.6% |
Key Takeaway: The Chicago Cubs are the NL’s version of the Yankees—a 96.6% playoff lock! They just swept the mighty Dodgers, and Pete Crow-Armstrong is playing like an MVP.
The Battle for Spots 2 & 3: Diamondbacks vs Phillies
The Disappointments: Padres and Pirates
Think of it like this:
Remember: The computer is rarely 100% correct. Baseball is chaotic! Injuries, slumps, hot streaks, and luck change everything. These are probabilities, not prophecies.
| League | Locks (95%+) | Coin Flips (40-65%) | Long Shots (<30%) |
|---|---|---|---|
| AL | Yankees, Red Sox | Tigers (41%) | Guardians, Rangers, Mariners, Orioles, Twins |
| NL | Cubs | Diamondbacks (63%), Phillies (57%) | Padres, Marlins, Cardinals, Pirates, Nationals |
Bottom Line: Enjoy the ride! The games still have to be played, and that’s why we watch. The supercomputer gives us a really smart guess—but October baseball loves a good upset.
A: In each league (AL and NL), 6 teams make the playoffs. The 3 division winners get in automatically. The next 3 best records (regardless of division) are the "Wild Cards." They play a best-of-3 series to advance.
A: It’s an average from thousands of simulations. In some simulations the Yankees win 92 games, in others 89. The average is 90.5. It doesn’t mean they’ll win half a game!
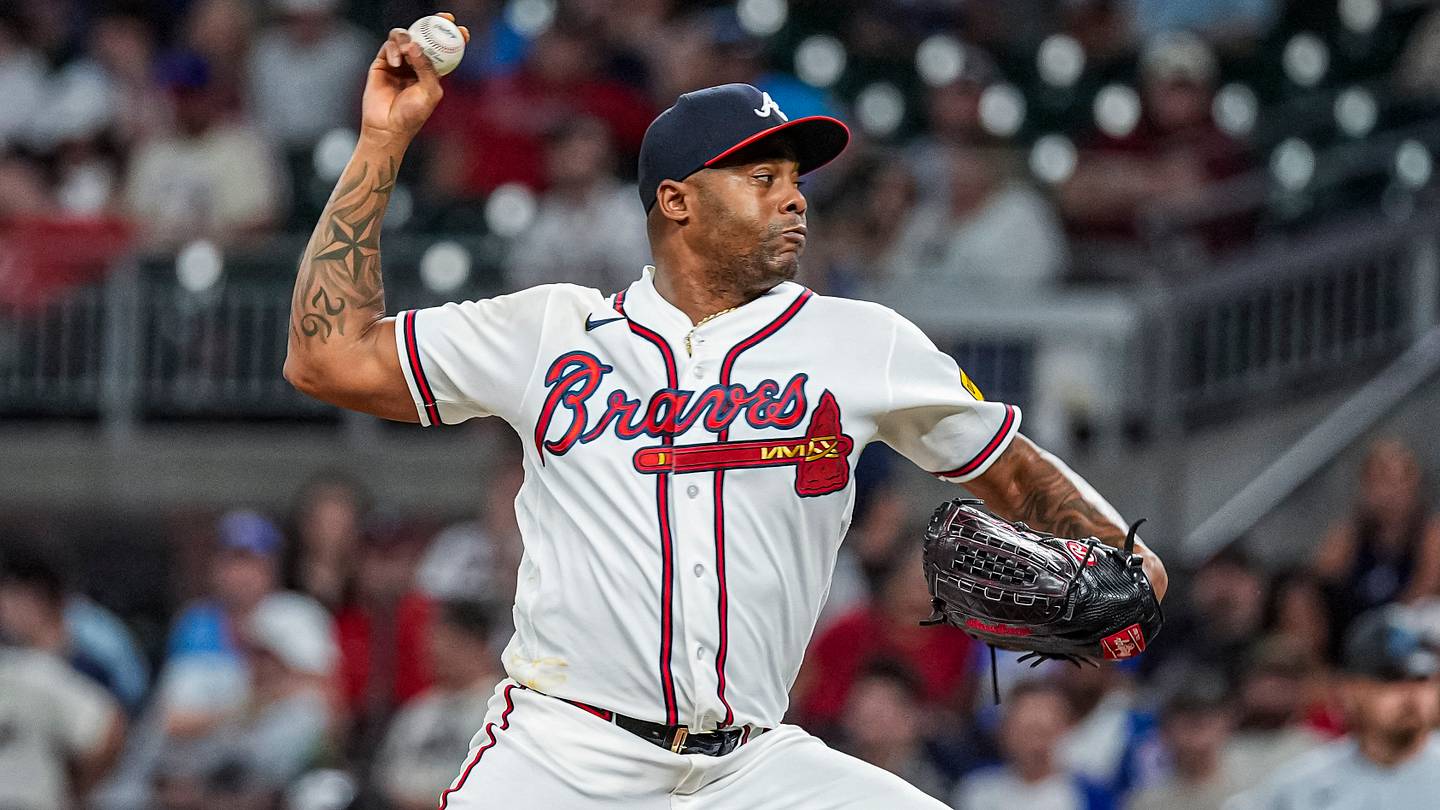
A: The model looks at everything: remaining schedule, current roster, minor league depth, and how players similar to Troy Melton have performed. It sees something the "eye test" might miss—or it could be wrong!
A: Absolutely! Opta updates projections daily based on game results, injuries, and performance. A 41% chance today could be 60% next week (or 10%).
A: NO! These are for fun and analysis only. Sports betting involves risk, and even the best models fail. Never bet more than you can afford to lose—and check your local laws.
Data sourced from Opta Analyst via The Analyst. Projections current as of post-trade deadline 2024 season.