GOOGL Stock Drop: A Super Simple Guide to What’s Happening (July 2026)
Why GOOGL Matters to the Whole World
Alphabet (the company behind Google) is traded under the ticker GOOGL. It isn’t just any stock — it’s one of the biggest pieces in world stock market indexes. That means when GOOGL goes down, index funds from New York to Jakarta quietly feel the drag too.
- Latest session: stock fell 2.17% to $346.77 (data from Yahoo Finance, 17 July 2026)
- Over the past month: down 4.68%
- Big question: is this just a pause, or the start of a deeper drop?
Trend & Price Action
The trend is down — plain and simple.
- A moving average (MA) is just the average closing price over a period. Think of it as the "typical" price lately.
- Price is below the 20-day average (SMA20) at $355.90 (falling ~0.55% every 5 days)
- Price is also below the 50-day average (SMA50) at $370.59
- When price is under both, recent buyers are mostly losing money
- The 20-day line is already below the 50-day line = a bearish (downward) signal
Right now the price is at only 28% of its 20-day range, near the bottom.
- Bollinger Bands are like stretchy envelopes around the average price (2 standard deviations out)
- The %B reading is 24%, meaning price is pressing the lower band at $338.27
- That lower band almost matches the 20-day support at $337.39 — a "shelf" where bargain hunters often show up
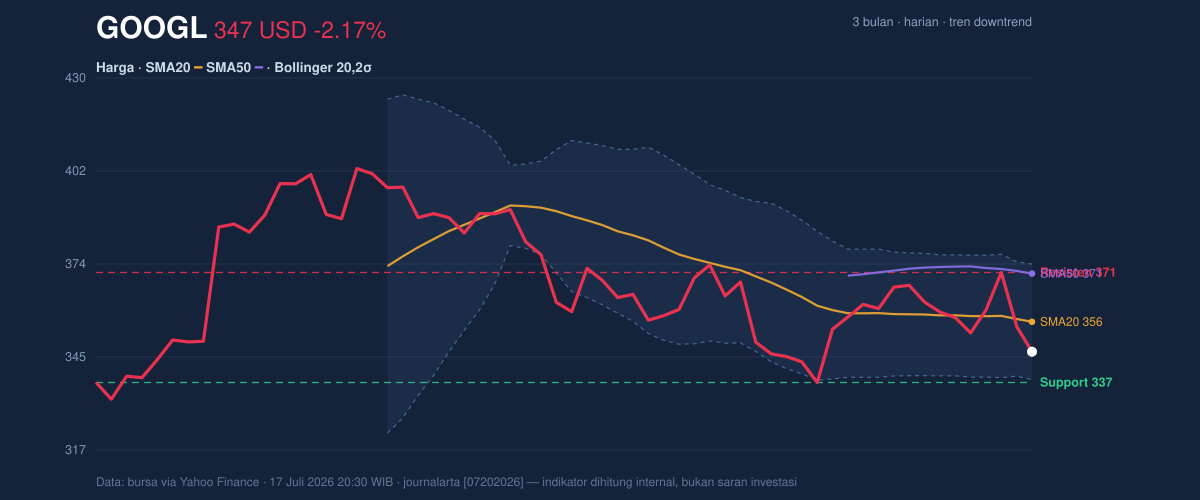
3-month price action chart of GOOGL: price, SMA20/50, Bollinger, support & resistance. Data: exchange via Yahoo Finance.
Oscillators & Momentum
Momentum is sending a mixed message — and that mix is the real story.
- RSI (Relative Strength Index): a 0–100 score of recent wins vs losses. At 42.5, it’s neutral — weak, but not "panic selling" (which is under 30)
- Stochastic: shows %K at 17.6 vs %D at 55.1 — oversold! Short-term selling is stretched, so a small bounce is likely
- MACD: tracks the gap between two averages. Line at -2.312, signal at -2.359, histogram +0.047 (first positive tick!)
- Both still below zero = downtrend alive
- But decline is slowing = stabilization trying to form, not a reversal
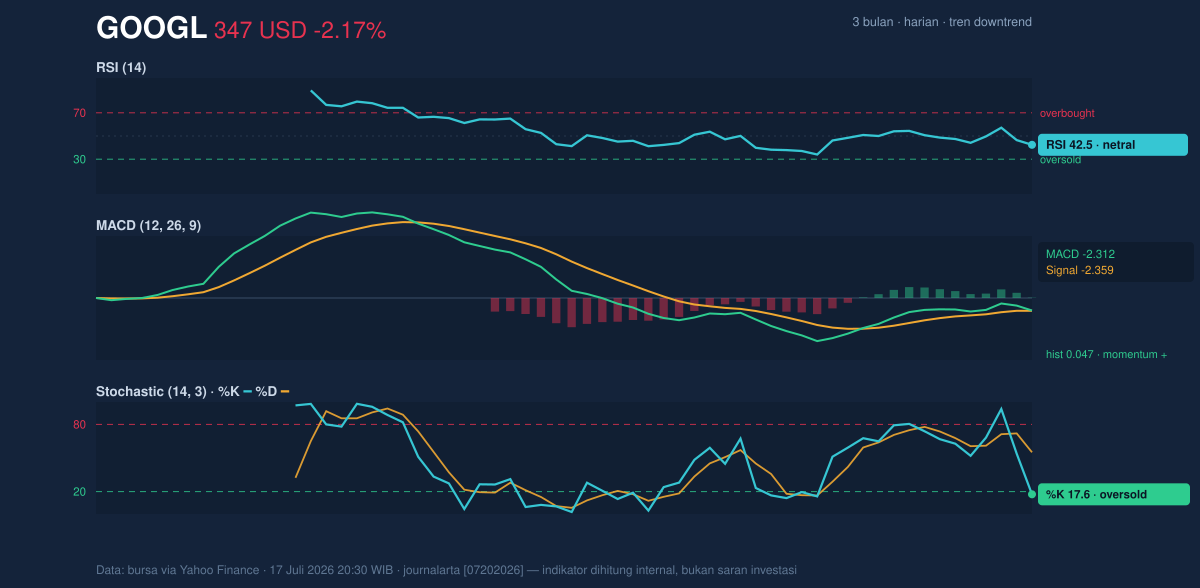
Momentum chart of GOOGL: RSI(14), MACD, Stochastic. Data: exchange via Yahoo Finance.
Volatility & Volume
Volatility is calm, not panicking.
- Band width: normal 9.9%
- ATR (Average True Range) = 11.07, about 3.2% of price = daily swings of ~$11 are normal
- No crazy squeeze or explosion expected
But volume says: no bottom yet.
- Last session: 29.9 million shares vs 20-day avg 35.4 million = only 0.8× normal
- On-Balance Volume (OBV) adds volume on up days, subtracts on down days — and it’s falling
- Translation: money is still leaking out; no big buyer stepped in
Key Levels & Scenarios
The fight zone is narrow.
- Support (floor): $337.39 (backed by lower Bollinger band)
- Below that: 3-month low $330.20 is last line before new lows
- Overhead (ceiling): SMA20 at $355.90, then resistance $370.92, upper band $373.53
- Distant memory: 3-month high $408.61
Possible moves:
- If price holds $337 and reclaims $355.90 with volume → run toward $370.92 possible
- If $337.39 breaks on rising volume → fast test of $330.20 (one ATR can cover it in a day)
Technical Verdict: HOLD
The call is HOLD (wait & see).
Why?
- Trend is down — price below SMA20 & SMA50, short average sloping down = fighting the tape
- Stabilization unconfirmed — positive MACD tick + oversold Stochastic hint bounce, but RSI 42.5 = no real capitulation
- Sellers control — falling OBV + 0.8× volume = no accumulation yet
Important: Verdict invalidated if price falls below $337.39 (exposes $330.20, turns fully bearish). A close above $355.90 upgrades picture to constructive.
- Entry Range: $337.39 – $338.27 (support/lower-band shelf, only on stabilization signs)
- Exit Target: $355.90 first (SMA20), then $370.92 (resistance)
- Stop Loss: below $330.20 (under 3-month floor)
This is technical analysis, not investment advice; site disclaimer applies.
For non-traders: sellers have the ball, buyers wait quietly at the door. Old saying: "patience is also a position."
Summary Data GOOGL
| Item |
Value |
| Last price |
346.77 USD |
| Change 1 day / 5 days / 1 month |
-2.17% / -2.91% / -4.68% |
| Trend / MA-cross |
downtrend / none |
| SMA20 / SMA50 |
355.90 / 370.59 |
| RSI (14) / Stochastic %K |
42.5 / 17.6 |
| Bollinger %B / ATR |
24% / 11.07 |
| Support / Resistance 20 days |
337.39 / 370.92 |
| Data as of |
17 July 2026 20:30 WIB |
Summary
GOOGL dropped to $346.77, in a clear downtrend below key averages. Momentum shows early stabilization signs (MACD tick, oversold Stochastic) but no confirmation (RSI neutral, volume low, OBV falling). Key floor is $337.39; ceiling $355.90. Verdict: HOLD, watch those levels, not financial advice.
FAQ
Q1: What is a moving average in kid terms?
A: It’s the average price over a set number of days — like a smoothed line showing the "usual" cost lately.
Q2: Why does low volume matter?
A: Low volume means few people are trading — no big buyers are confirming a bottom, so the drop may continue.
Q3: What does "oversold" mean?
A: It means selling got extreme short-term, so a small rebound may happen — but it’s not a guarantee the downtrend ends.
Q4: Is this a buy signal?
A: No. The verdict is HOLD. Only consider entry near $337–338 if stabilization shows, with a stop below $330.20.
Q5: What kills the HOLD call?
A: A drop below $337.39 (bearish) or a close above $355.90 (constructive).
 1
1