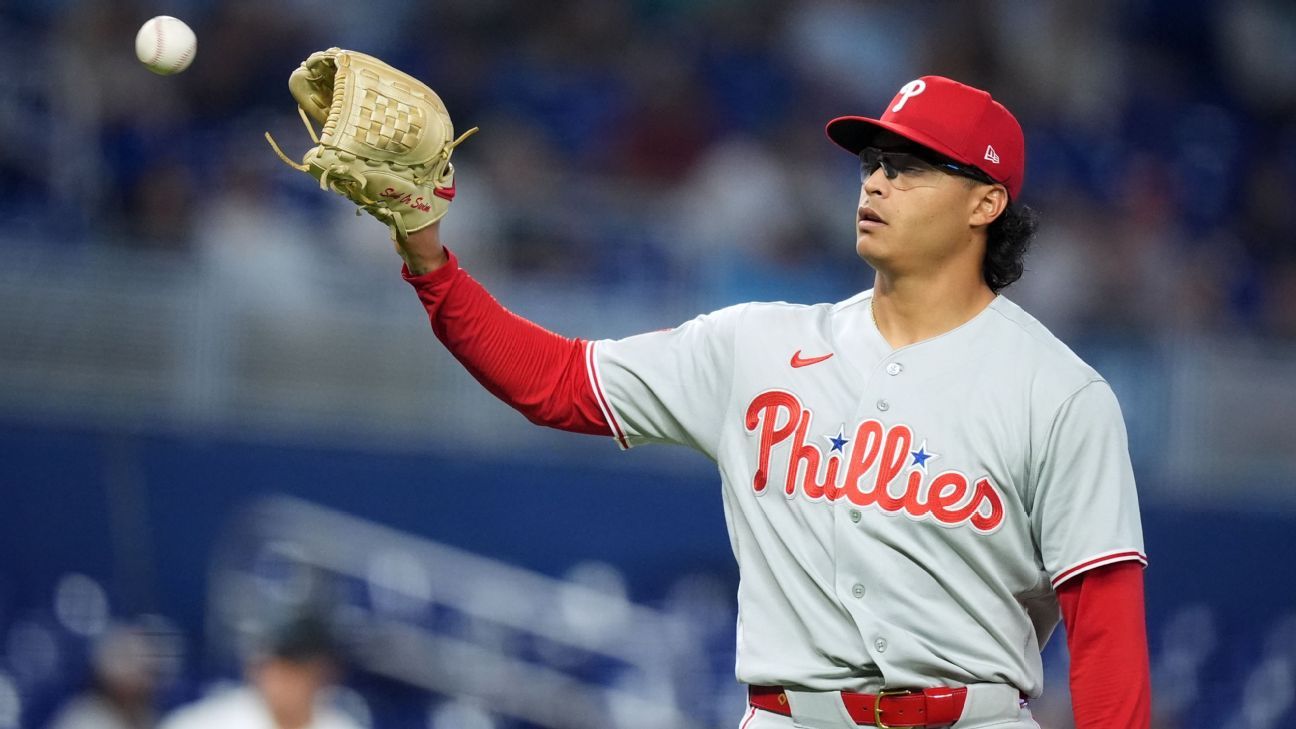
Tuesday Best Bet: Phillies Feast on Gutted Nationals
MLB Betting Guide: Top Prop Bets & Team Projections for Tuesday, August 4, 2026
By Derek Carty | ESPN Fantasy Baseball Contributor & EV Analytics Founder
What Is This Article About?
Welcome! If you’re new to MLB betting, you’re in the right place. This guide breaks down the best prop bets (wagers on specific player performances) and team projections for Tuesday’s games, powered by THE BAT X—a sophisticated projection system that mimics the analytics used by actual MLB front offices.
KEY CONCEPT: Expected Value (EV)
Think of EV as the "quality score" of a bet. It measures how much profit you’d expect to make on average if you placed the same $1 bet 100 times.
- Positive EV (Green) = Good bet (mathematically profitable long-term)
- Negative EV (Red) = Bad bet (mathematically loses money long-term)
- Example: A $25 EV means for every $100 wagered (100 x $1 bets), you’d expect ~$25 profit over time.
Section 1: Tuesday’s Top Batter Prop Bets
These are wagers on specific hitters. "OVER 0.5 HR" means "Will this player hit at least 1 home run?" "UNDER 0.5 H" means "Will this player get zero hits?"
| Player | Bet | Odds | Win Probability | Expected Value (EV) | Why It’s Interesting |
|---|---|---|---|---|---|
| Tyler O’Neill | OVER 0.5 HR (Hit a HR) | +556 | 21% | $38.28 | Highest EV on the board. High risk, massive reward potential. |
| Taylor Ward | OVER 0.5 HR (Hit a HR) | +820 | 13% | $20.70 | Longshot "lottery ticket" with solid mathematical backing. |
| Josh Lowe | OVER 0.5 RBI (Drive in a run) | +302 | 31% | $23.37 | Highest probability batter prop; RBI chances are more frequent than HRs. |
| Kyle Schwarber | UNDER 0.5 H (Zero hits) | +201 | 38% | $14.20 | Betting on a strikeout/0-for night. High variance but positive EV. |
| Randal Grichuk | UNDER 0.5 H (Zero hits) | +141 | 47% | $13.27 | Highest win probability of all batter props. "Safest" batter play. |
BEGINNER TIP: Understanding Odds
- +556: Bet $100 to win $556 profit (plus your $100 back).
- -110: Bet $110 to win $100 profit (standard "juice").
- Positive odds (+) = Underdog/less likely. Negative odds (-) = Favorite/more likely.
Section 2: Tuesday’s Top Pitcher Prop Bets
These focus on pitcher performance. "UNDER 4.5 K" means "Will the pitcher strike out 4 or fewer batters?" "UNDER 2.5 ER" means "Will they allow 2 or fewer earned runs?"
| Pitcher | Bet | Odds | Win Probability | Expected Value (EV) | Why It’s Interesting |
|---|---|---|---|---|---|
| Logan Henderson | UNDER 6.5 K | -114 | 65% | $25.83 | HIGHEST EV OVERALL. High confidence in a "low strikeout" outcome. |
| J.T. Ginn | UNDER 2.5 ER | -116 | 64% | $21.35 | Betting on a quality start (few runs allowed). Very strong projection. |
| Davis Martin | UNDER 4.5 K | -107 | 61% | $19.99 | Similar to Henderson; model sees fewer Ks than market expects. |
| Jared Jones | UNDER 5.5 K | -101 | 60% | $20.02 | Near even-money odds with a 60% projected win rate. |
| Jesus Luzardo | UNDER 1.5 ER | +105 | 58% | $18.70 | Plus-money odds on a top-tier pitcher allowing ≤1 run. Great value. |
IMPORTANT: "UNDER" on Strikeouts?
Betting UNDER on strikeouts might feel weird (we usually cheer for Ks!). But the market often overestimates how many Ks a pitcher will get. THE BAT X identifies when the line is set too high.
Section 3: THE BAT X Team Projections (How to Read the Big Table)
The massive table below projects every game. Don’t panic! Here is your decoder ring for the columns:
| Column | What It Means | What to Look For |
|---|---|---|
| PITCHER | Starting pitcher + Team Logo | Matchup context. |
| MONEY LINE | Odds to win the game outright | + = Underdog, – = Favorite. |
| PROJ. WIN% | THE BAT X’s calculated win probability | Compare to implied odds of the Money Line. |
| VALUE % (ML) | Edge on Moneyline | Green/Positive = Good bet. Red/Negative = Avoid. |
| RUN LINE | Spread (usually ±1.5 runs) | Favorite must win by 2+; Underdog can lose by 1. |
| VALUE % (RL) | Edge on Run Line | Same logic: Green = Value, Red = Trap. |
| GAME TOTAL | Projected total runs (Over/Under) | Standard O/U line. |
| O/U | Odds on Total | Usually -110ish. |
| xRUNS | Expected Runs (Model’s prediction) | The most important number! |
| VALUE % (Total) | Edge on Game Total | Green = Bet Over/Under has value. |
How to Spot the Best Team Bets (Step-by-Step)
- Ignore the Red: Any row with Red/Negative Value % is a bet the model says avoid.
- Hunt the Green: Look for Green/Positive Value % (especially > 5% or > 10%).
- Cross-Reference: Does the Moneyline, Run Line, and Total all agree? Even better.
Top "Green Light" Team Plays from the Table
| Game | Best Bet | Value % | Why? |
|---|---|---|---|
| PIT @ MIL | Pittsburgh Moneyline (+138) | +14.12% | Jared Jones projected to win 48% vs 52% implied odds. Big dog value. |
| ATH @ CIN | Athletics Moneyline (+113) | +12.27% | J.T. Ginn projected 52.7% win vs 47.3% implied. |
| ATH @ CIN | Athletics Run Line (+1.0) | +11.84% | Backup if you want the 1-run cushion. |
| PHI @ WSH | Phillies Run Line (-1.5) | +12.40% | Luzardo dominant; model loves Philly covering 1.5. |
| NYM @ CLE | Mets Moneyline (+128) | +3.99% | Manaea undervalued vs Cantillo. |
| NYM @ CLE | Game Total OVER 7.5 | +7.35% | Model projects 9.03 runs (xRUNS). |
| DET @ SEA | Game Total OVER 8.0 | +9.94% | Model projects 9.55 runs. High scoring expected. |
| LAD @ CHC | Game Total UNDER 9.0 | +4.13% | Assad/Skubal duel; model sees pitchers’ duel (9.05 xRUNS vs market lean). |
RED FLAGS (Avoid These Sides)
- BAL vs LAA: Baltimore side shows -9.61% ML value (Overpriced favorite).
- MIL vs PIT: Milwaukee side shows -16.78% ML value (Heavy favorite trap).
- CIN vs ATH: Cincinnati Run Line shows -27.07% value (Massive negative EV).
- WSH vs PHI: Washington side shows -20% to -23% value across the board.
Section 4: Top Betting Trends (Use With Caution!)
THE FINE PRINT: Trends are descriptive (what happened), not predictive (what will happen). The article explicitly warns: "Past results are never fully predictive of future performance." Treat these as fun context, not primary reasons to bet.
| Team | Trend | Record | ROI | Current Line |
|---|---|---|---|---|
| Athletics | Road F5 Team Total UNDER | 14-0 | +73% | 1.5 runs @ +120 |
| Tigers | Team Total OVER | 6-0 | +92% | 3.5 runs @ -120 |
| Rangers | Team Total UNDER | 6-0 | +89% | 4.5 runs @ -120 |
| Nationals | Team Total UNDER | 6-0 | +76% | 3.5 runs @ -135 |
- F5 = First 5 Innings (betting on the starting pitchers mostly, before bullpens enter).
- Team Total = Runs scored by only that team (not combined).
Summary & Action Plan
- Best Overall Mathematical Bet: Logan Henderson UNDER 6.5 K (-114) — $25.83 EV.
- Best High-Upside Lottery Ticket: Tyler O’Neill OVER 0.5 HR (+556) — $38.28 EV (Low probability, massive payoff).
- Best "Safe" Pitcher Bet: J.T. Ginn UNDER 2.5 ER (-116) — 64% win prob, $21.35 EV.
- Best Team Value: Pittsburgh Moneyline (+138) & Athletics Moneyline (+113) — Both >12% Edge.
- Best Total Bet: Mets/Guardians OVER 7.5 (+7.35% Edge) or Tigers/Mariners OVER 8.0 (+9.94% Edge).
Golden Rule: Only bet Positive EV (Green) plays. Negative EV bets are how sportsbooks build their mansions.
FAQ: Your Questions Answered
1. What does "THE BAT X" actually do?
It’s a computer model (algorithm) that simulates games thousands of times. It inputs player talent, ballpark factors, weather, umpire tendencies, bullpen strength, defense, and catcher framing to spit out probabilities. It’s like a super-charged version of what MLB teams use internally.
2. Why are some "Value %" numbers negative (Red)?
That means the sportsbook’s odds are better than the true probability. The market has overestimated that team/player. Betting those sides loses money long-term. Red = Stay Away.
3. I see "xRUNS" at 10.46 but the Game Total is 8.5. What gives?
xRUNS is the model’s raw expected total runs (10.46). The Game Total (8.5) is the sportsbook’s line. The model thinks this game will be a slugfest (10+ runs), so the OVER 8.5 has massive value (+10.53%). The market is underestimating the offense.
4. Can I just bet the "Trends" (like Athletics 14-0)?
Please don’t. A 14-0 streak is extremely rare and usually fueled by luck/small sample size. The model (THE BAT X) accounts for why it happened (pitchers, parks, opponents). The trend is just the result. Bet the cause (the model), not the effect (the streak).
5. What bankroll management should a beginner use?
Flat Betting: Bet the same small unit (1-2% of your total bankroll) on every Positive EV play. Do not chase losses. Do not double up on "locks." Trust the math over the long haul (100+ bets).
Disclaimer: This article is for educational and entertainment purposes. Sports betting involves risk. Only wager what you can afford to lose. All projections via THE BAT X / EV Analytics.